
Leading Indicator: Interpreting North American Semi Equipment Billings
North American semiconductor equipment billings are one of the industry’s most watched data points. They capture how much chipmakers are actually spending on tools—lithography systems, etch and deposition equipment, inspection and metrology gear, and packaging machines—to build and upgrade fabs.
When billings rise consistently, they often signal that wafer fabs expect stronger utilization and are preparing for growth. When they fall, they can hint at upcoming pauses, corrections, or a more cautious stance on long‑term demand. This article explains what equipment billings represent, why they matter, how to interpret their cycles, and how different stakeholders—from investors to procurement teams and engineers—can use them to make better decisions.
What North American equipment billings actually measure
Equipment billings typically refer to the dollar value of semiconductor manufacturing tools shipped or invoiced by equipment vendors over a defined period (often monthly or quarterly) to customers in North America. These tools include front‑end equipment used in wafer processing and back‑end equipment used in assembly, packaging, and test.
Key characteristics of these billings make them uniquely informative:
First, they reflect real spending rather than just intentions. While orders show what customers plan to buy, billings show tools that are far enough along—manufactured, accepted, and shipped—that fabs are committing capital and installation resources.
Second, they are geographically focused. North American billings tell a story about investments by U.S., Canadian, and Mexican chipmakers, as well as foreign companies building or expanding fabs in the region. In an era of regionalization and industrial policy, this geographic focus matters.
Third, they are tied to technology mix. The composition of billings—how much is for leading‑edge lithography versus mature‑node etch or packaging—reveals where capacity expansion is happening and which nodes and processes are receiving the most attention.
Why equipment billings are a leading indicator
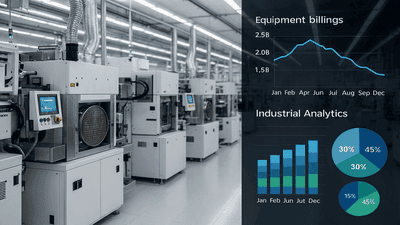
Equipment billings lead broader semiconductor metrics because of the industry’s long investment and installation cycles. A tool ordered today may take months to build, ship, install, qualify, and ramp to full use. Only after this chain does it meaningfully contribute to wafer output and revenue.
That lag creates a multi‑step sequence:
- Macro and end‑market demand shifts (e.g., AI, automotive, industrial) change how much capacity chipmakers think they need.
- Fabs and foundries adjust capex plans and place equipment orders.
- Equipment vendors produce and ship tools, which show up as billings.
- Installed tools eventually drive higher wafer starts, which translate into chip shipments and revenue.
Because billings sit in the middle of this chain—after planning decisions but before output growth—they are a practical leading indicator of what the next 12–24 months may look like in terms of capacity and technology deployment.
How to read the equipment billing cycle
Interpreting North American equipment billings requires more than tracking one month’s number. The cycle has phases that usually align with broader semiconductor dynamics:
1. Early uptick phase. After a period of subdued investment, billings begin to rise as fabs cautiously restart projects, often focused on specific segments—such as AI logic, automotive power devices, or industrial analog. Early upticks may show up first in certain tool categories (e.g., advanced lithography or packaging equipment) before broadening.
2. Expansion phase. As confidence grows, billings climb more broadly across equipment types. Fabs commit to full lines rather than incremental tool additions, and utilization expectations for existing capacity rise. This phase often coincides with rising foundry utilization and stronger revenue guidance from chipmakers.
3. Peak and plateau phase. At some point, equipment billings reach high levels and may plateau. Most major capacity projects are underway, and incremental additions focus on fine‑tuning or modest expansions. At this stage, the risk of over‑capacity begins to increase, especially if end‑market demand slows unexpectedly.
4. Correction phase. If demand expectations prove too optimistic or if inventories build up, new orders slow and billings decline. Fabs may defer or cancel planned installations, and equipment vendors see backlog shrink. This phase often precedes or coincides with broader semi downturns.
Understanding where billings sit within this cycle helps stakeholders judge whether current numbers signal early‑stage growth that may last or late‑cycle exuberance that requires caution.
Technology mix: advanced nodes vs mature and specialty

The headline value of North American equipment billings is important, but the mix of tools within that value may be even more revealing. Equipment spending tends to align with specific node and technology strategies.
Advanced logic and AI nodes. Spending on leading‑edge lithography, high‑performance etch and deposition, and advanced inspection tools suggests investment in sub‑5 nm or similar cutting‑edge processes. When this category dominates billings, it often implies a focus on AI accelerators, high‑performance CPUs and GPUs, and advanced networking silicon.
Mature nodes and specialty processes. Increased billings for tools tuned to 28 nm and above, power devices, analog, and mixed‑signal processes highlight investment targeted at automotive, industrial, and consumer components that don’t require the most extreme scaling but do require reliability and volume.
Packaging and test. Rising billings for advanced packaging—such as 2.5D/3D integration, chiplet assembly, fan‑out packaging—and sophisticated test equipment indicate a push to improve system‑level performance and bring more packaging capacity onshore. This is particularly relevant for high‑bandwidth memory (HBM) and AI‑centric platforms.
By tracking the relative growth of these segments within total billings, one can infer whether the North American investment story is driven more by AI and leading edge, by automotive and industrial resilience, or by packaging and back‑end upgrades.
Regional and policy context
North American equipment billings do not exist in a vacuum. They reflect both corporate strategy and policy frameworks that encourage or subsidize local manufacturing.
Recent years have seen significant government initiatives aimed at expanding domestic fab capacity, advanced packaging, and upstream supply chains. Equipment billings rise when projects tied to these initiatives move from planning into execution. Changes in billings may therefore indicate whether policy incentives are translating into actual tool installations.
Furthermore, billings can show how foreign companies are investing in North America—global foundries and IDMs building new or expanded sites to serve regional customers and comply with security or supply‑chain requirements. A surge in billings accompanied by announcements of new fabs often reflects this combination of domestic and foreign capital responding to policy signals.
How investors can use equipment billings
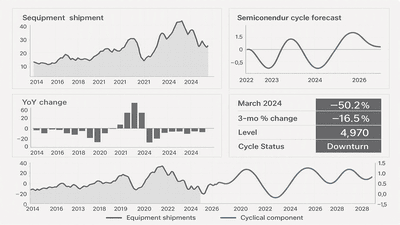
For investors, North American semi equipment billings can be a valuable input to both top‑down and bottom‑up analysis.
Top‑down cycle assessment. Rising billings over several consecutive periods typically signal that the cycle is in an expansion phase and that future fab utilization and chip revenues may strengthen. Declining billings hint at late‑cycle dynamics or early signs of correction.
Subsector rotation. Shifts in the mix of billings—toward advanced lithography, toward power and analog tools, or toward packaging equipment—can inform sector rotation strategies. For example, a sustained rise in packaging billings might favor companies leveraged to advanced packaging and HBM ecosystems.
Equipment vendor prospects. Billings directly reflect revenue for equipment suppliers. Consistent growth in billings, combined with commentary about strong backlogs, supports constructive views on certain tool makers. Conversely, sharp declines may suggest caution.
Capex sustainability. Investors can compare billings trends to the capex guidance of major chipmakers. If billings and announced capex trajectories align, it strengthens confidence in sustainability; if they diverge, it may indicate adjustments coming.
How OEMs and procurement teams can use billings
OEMs and component procurement teams can also glean actionable insights from equipment billings data.
Lead‑time and capacity risk. Rising billings imply more tools heading into fabs, which will eventually expand capacity. However, during the ramp, existing lines may be tight, and lead times can stretch. Monitoring billings helps anticipate when certain nodes or packaging services may become constrained.
Supplier resilience. If billings show strong investment in the nodes and technologies relevant to an OEM’s products, it suggests future capacity will be available. Conversely, weak billings in critical segments may prompt more aggressive supply agreements or diversification.
Geographic sourcing decisions. Because billings are regional, they hint at where capacity will be located. OEMs can use this information to adjust sourcing strategies, potentially favoring suppliers whose capacity is closer to their own manufacturing sites or who are benefiting from robust local investment.
Risk mapping. Changes in billings can indicate where the industry is over‑investing or under‑investing. Procurement teams can build risk maps around these signals, identifying potential future bottlenecks or pricing pressures in specific device types.
Engineering and product strategy implications
For engineers and product planners, equipment billings connect to technology roadmaps and manufacturability.
Node availability and migration timing. If billings for advanced‑node equipment are rising, it suggests that more leading‑edge capacity will come online within a given timeframe. Product teams can use this insight to plan migrations from older nodes, balancing yields, costs, and availability.
Packaging choices. Strong growth in packaging equipment billings signals industry investment in new packaging technologies. Engineering teams designing systems that rely on chiplets, HBM, or advanced stacking can plan roadmaps aligned with when these capabilities are likely to be widely available in North America.
Design for manufacturability. When billings favor mature‑node and specialty processes, it may be prudent to design products that leverage those robust capacities rather than assuming immediate access to the latest nodes. Practical manufacturability often beats theoretical performance if capacity is tight.
Collaborative opportunities. Rising investment in particular tool types or process segments may open opportunities for co‑development between OEMs and fabs, aligning process tweaks with product needs.
Limitations and caveats in interpreting billings
Despite their usefulness, equipment billings have limitations that users must respect.
Volatility and timing noise. Monthly or quarterly billings can be volatile due to shipment timing, large one‑off orders, or accounting variations. It’s wise to look at moving averages and multi‑period trends rather than single data points.
Global context. North American billings are only part of the global picture. Investment in other regions may be just as important for supply dynamics and technology progress. Interpreting these numbers in isolation can give an incomplete view.
Segment granularity. Aggregate billings do not always distinguish clearly between front‑end and back‑end tools or between nodes. Additional detail is often needed to understand which exact technologies are driving changes.
Policy and subsidy distortion. Government incentives can accelerate billings that might not align perfectly with pure market demand. This can temporarily boost spending in certain categories without guaranteeing long‑term utilization.
Putting it all together: a practical framework
To make North American semi equipment billings genuinely useful, stakeholders can adopt a simple framework:
- Track multi‑period billings trends, focusing on direction and magnitude rather than single months.
- Compare billings trends to foundry utilization, chipmaker capex guidance, and inventory commentary.
- Examine the mix of billings by tool type and process segment to infer where capacity and technology are moving.
- Use billings as one input among several—alongside demand indicators, pricing trends, and macro data—to build scenarios.
- Update strategies for investment, sourcing, and product design as billings confirm or challenge existing assumptions.
Conclusion: a high‑signal, not standalone, indicator
North American semiconductor equipment billings provide a high‑signal window into the industry’s future, revealing where fabs are putting real money behind expansion, which technologies they are prioritizing, and how confident they are in long‑term demand. Interpreted carefully, these data help investors anticipate cycles, OEMs manage supply risks, engineers plan node and packaging migrations, and policymakers gauge whether industrial initiatives are translating into concrete installations.
At the same time, billings should be treated as part of a broader toolkit, not a standalone oracle. Only by combining them with utilization metrics, pricing trends, end‑market demand indicators, and global investment data can stakeholders form robust views of where the semiconductor sector is heading—and how best to position themselves for the next phase of growth.